The Project Complexity Puzzle

Project complexity is one of the most debated topics in the field of project management, perhaps second only to that of project success. Why are we so interested? At least with project success, it is about the realisation of outcomes (benefits) and ultimately the level of our achievement in delivering positive change.
But project complexity is more concerned with the magnitude of the challenge ahead of us, and hence is not an output but rather an input to the management of the change process before we begin.
Can we deliver what is required? What do we need to do to ensure expected success does not turn into failure? How can the difficulty of the challenge be assessed, and why is this important?
“The purpose for assessing project complexity is to understand the magnitude of the challenge in delivering future change”
Bakhshi et al. (2016) explores the historical development of project complexity. For the period 1990 to April 2015, they identify 783 publications related to complex projects, of which 423 specifically address project complexity.
Over a period of 25 years, more than 125 different complexity factors are identified. The outcome of their review is shown in Figure 1.
While this taxonomy is interesting and evidenced-based, it is far from practical in terms of assessing the level of project complexity in the real world. A search of Google images on ‘project complexity’ finds a large number of frameworks and models available for this purpose. There appears little consensus about which is best.
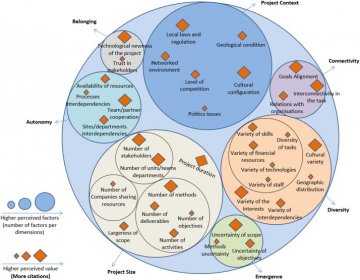
Figure 1: Primary project complexity factors according to number of citations (Source: Bakhshi et al. 2016)
Oehmen et al. (2015) provide a useful typology for complexity decision-making. They define projects as simple, complex and chaotic. Simple projects are characterised by stability and clear cause-and-effect relationships.
Complex projects are characterised by unforeseen emergent behaviour that is fundamentally still tractable by structured analysis. Chaotic projects are where the relationships between cause and effect are impossible to determine because they shift constantly and no manageable patterns exist, only turbulence.
Others (e.g. Snowden & Boone 2007; Sheffield et al. 2012) also refer to complicated and dynamic projects.
The Cynefin framework (see Figure 2) was developed at IBM to describe decision-making practices within their organisation. It has since helped to inform project complexity thinking.
It uses obvious, complicated, complex and chaotic realms, plus ‘disorder’ that reflects the gaps within. The recommended responses should not be interpreted as reflecting better or worse practice – just different approaches.
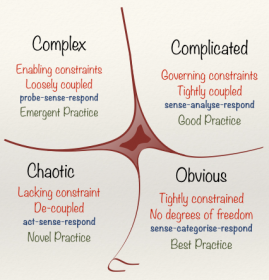
Figure 2: The Cynefin framework (Source: adapted from Snowden & Boone 2007)
Whatever labels are adopted, it is generally agreed that project complexity lies on a continuum from simple to chaotic.
This continuum implies increased uncertainty from what is commonly called known knowns, to known unknowns and unknown unknowns, and can even include the concept of ‘wicked’ problems that challenge effective resolution at all.
Complex projects are further defined in Oehmen et al. (2015) as comprising all of the following characteristics:
- Containing multiple parts
- Possessing a number of connections between the parts
- Exhibiting dynamic interactions between the parts
- The behaviour produced as a result of those interactions cannot be explained as the simple sum of the parts (i.e. emergent behaviour)
The CIFTER model is a practical attempt to assess a project’s management complexity using seven complexity factors and four performance/rating descriptors, as shown in Figure 3. Scores can lie between 7 and 28 inclusive.
Since the characteristics of a project’s management may change over time, the CIFTER factors may change over time as well. These characteristics deal with issues of size, importance to stakeholders, and externalities that are often beyond the control of the project manager.
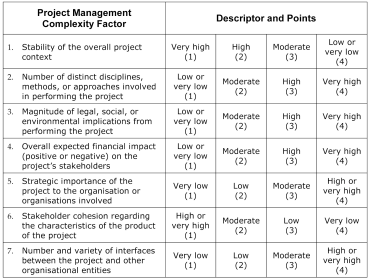
Figure 3: CIFTER model (Source: GAPPS 2007)
A Way Forward
Dao et al. (2016:481) set a challenge for us all. They believe that “implementing proper management strategies relevant to the identified complexity indicators helps organisations in reducing the likelihood that the associated attributes will cause poor project performance”.
But it is also critical that the factors must be practical and readily measurable at the initiation of a new project. Determining the level of complexity ahead enables the right approach to be pursued that will increase the likelihood of a successful outcome.
To assess the likely position of a new project on the complexity continuum, a means of scoring key project variables must be established. We propose a novel forecasting tool that can be applied at the project initiation phase to determine expected complexity, represented by a number between 1 and 27 inclusive.
Known as the Complexity Forecasting Cube (CFC), it takes the form of a 3D matrix that reflects simple (low score) to chaotic (high score) projects based on X, Y and Z coordinates.
The CFC model draws on previous literature to derive the following three generic key project variables, each being assessed using a score of low, moderate or high to reflect its potential complexity:
- X coordinate: the scale of the challenge (low = local, moderate = regional/ national, high = international)
- Y coordinate: the extent of uncertainty (low = mostly known knowns, moderate = many known unknowns, high = many unknown unknowns)
- Z coordinate: the diversity of stakeholders (low = single client, contractor and/or market, moderate = multiple clients, contractors and/or markets, high = broad community of project stakeholders displaying a wide range of interests and power)
Figure 4 summarises the proposed model, which is akin to a Rubik’s cube (3x3x3 matrix). Each row of the cube is shown separately for greater clarity.
The forecasted complexity score (computed as the multiplication of all three coordinates) signifies if a project is likely to be seen as simple (1-2), low complexity (3-4), complex (5-8), high complexity (9-15) or chaotic (16-27). Darker colours indicate higher complexity.
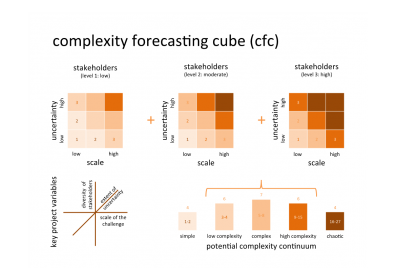
Figure 4: Generic CFC model (Source: authors)
Projects that are potentially simple are likely to be managed using largely linear methods and well-documented management techniques. The range of complex projects is likely to require more sophisticated planning regimes (especially in regard to risk and stakeholder engagement).
Where scale is expected to be high, a Waterfall (or pre-planning) mindset may be more appropriate. Alternatively, where uncertainty is expected to be high, an Agile (or adaptive) mindset may be more appropriate.
Projects that are potentially chaotic are likely to be managed as interacting systems using modelling tools to improve knowledge of causal relationships and their dynamic and shifting nature over time.
The complexity puzzle can be interpreted as a Rubik’s-like cube, where the three dimensions to be measured focus on project scale, uncertainty and stakeholders.
The CFC model is primarily designed to apply to individual projects, but it can also apply to groups of aligned projects (i.e. program) or groups of projects and programs (i.e. portfolio) by changing the previous X coordinate assessment to reflect the scale of the management challenge (low = project, moderate = program, high = portfolio).
The link between project complexity and project success is under-explored. So it is likely that interest in these two highly scrutinised topics is set to continue for many years. Appropriate management approaches for dealing with complexity need to be identified early.
This is especially true for future projects that are considered too big or too important to fail. Solving the complexity puzzle is key.
Authors: Dhavalkumar Dhaduk and Craig Langston at Bond University.
_______________
References
- Dao, B., Kermanshachi, S., Shane, J., Anderson, S, & Hare, E. (2016). Identifying and measuring project complexity. Procedia Engineering, 145, 476-482.
- GAPPS (2007). A framework for performance based competency standards for global Level 1 and 2 project managers. Global Alliance for Project Performance Standards. (available online at https://globalpmstandards.org/tools/complexity-rating/project-complexity/, accessed 18/08/19)
- Oehmen, J., Thuesen, C., Parraguez, P., & Geraldi, J. (2015). Complexity management for projects, programmes, and portfolios: an engineering systems perspective. Project Management Institute, Pennsylvania.
- Sheffield, J., Sankaran, S., & Haslett, T. (2012). Systems thinking: taming complexity in project management. On the Horizon, 20(2), 126-136.
- Snowden, D.J., & Boone, M.E. (2007). A leader’s framework for decision making: wise executives tailor their approach to fit the complexity of the circumstances they face. Harvard Business Review, November, 69-76.

